Last week I asked a question: can we predict in-game injuries? If we were starting Sam Darnold in week 1, was there any way to see his injury coming? I said the first step was a backtest to see if the signal is real. I ran it. Here is what I found.
Step 1: Can we even label an injury?
There is no clean dataset of “player left the game hurt.” So the idea was to find them in the snap counts: a player who normally plays most of the snaps suddenly plays less than half of his usual share, and then misses the next game or shows up on the injury report.
I ended up using nflverse instead of only the GridIron Data history, because it is free, public and goes back further. Snap counts there start in 2013, so the test covers 2013 through 2025. That gave me about 980 confirmed in-game exits, roughly 75 a season, out of 2,662 big snap drops.
Then I checked whether those labels were actually injuries. The play-by-play data often says “was injured during the play,” which is completely separate from the snap counts and the injury reports, so it makes a decent referee.
- My original rule was about 79% accurate. I wanted 85% before trusting it.
- A stricter rule, where the player was listed Out or Doubtful for the next game or simply missed it, came in around 87%. That is the version I kept.
- Practice reports on their own were close to a coin flip. A “limited” practice the next week is not the same thing as an injury.
So the signal exists. Now the harder question: can you see it coming before kickoff?
Step 2: The model
I gave the model ten things you would know before the game starts:
- Injury status going into the game (Questionable, etc.)
- Practice participation that week
- Prior in-game exits
- Age
- Position
- Touches over the last four games
- Days of rest
- Short week
- Turf or grass
- Special teams snaps
The one rule that matters most here: no peeking. Every input had to be public before kickoff. I wrote a test that deliberately scrambles everything from the future and fails if the model’s inputs change. It caught both of the mistakes I planted to check it.
I trained on 2013 through 2022, tuned on 2023 and 2024, and kept 2025 locked away until the very end so I could only score it once.
Step 3: The results
| 2025 (never seen by the model) | |
|---|---|
| Better than just guessing each position’s average | 1.3% |
| Injury rate in the top 10% riskiest players | 2.3x the average |
| Beat the average at every position | No (QBs failed) |
The top 10% list is the interesting part. The players the model flagged as riskiest really did leave games about twice as often as everyone else. But overall it was only about 1% better than simply knowing that, say, running backs get hurt more than quarterbacks. Quarterbacks were the one position where it lost to the simple average, and 2025 was a strange year for them: QBs left games at more than double their usual rate, on only 11 events.
When I looked at what the model was actually leaning on, it was mostly the injury report, practice participation and past injuries. That is information you already have if you read the injury report on Friday. The fancier inputs like workload and turf barely moved anything.
So, could we have seen Darnold coming?
Honestly, no. In-game injuries are rare, about 1.6% of the player-games I looked at, which works out to roughly 58 usable events a season. That is not much to learn from. A simple model and a heavily tuned one finished within a hair of each other, which tells me the limit is the data, not the math.
A risk tier that is 1 to 2% better than the base rate is not something I would put in front of people as a feature, and it is definitely not something worth paying for. So I am parking it. The model and the test are saved, and if I come back to it the next steps are more events (adding defensive players, looser thresholds) and a human review of a sample of the labels.
What I’m doing instead
The more useful idea from last week’s post was the real-time one: watch the news during games for “questionable to return” and push it out the moment it happens. That does not depend on predicting anything. It just needs to be fast. That is what I am building next for GridIron Data, and I will test it during live games over the next few weeks.
I also made sure GridIron Data now keeps its news and injury history for about three years instead of 90 days, so the next time I try this there will be a lot more of our own data to work with.
Not every experiment turns into a feature. This one turned into a better idea.
Week 4 and 5 Results
The real reason you all come here is to see how the team is doing. So I purposefully buried the content into the bottom so you have to read about player injuries and data sets!
Week 4 was BAD. Our team under performed and we ultimately lost by nearly 40 points. I checked out bench to see if we could have just picked the wrong players and it wouldn’t have mattered.
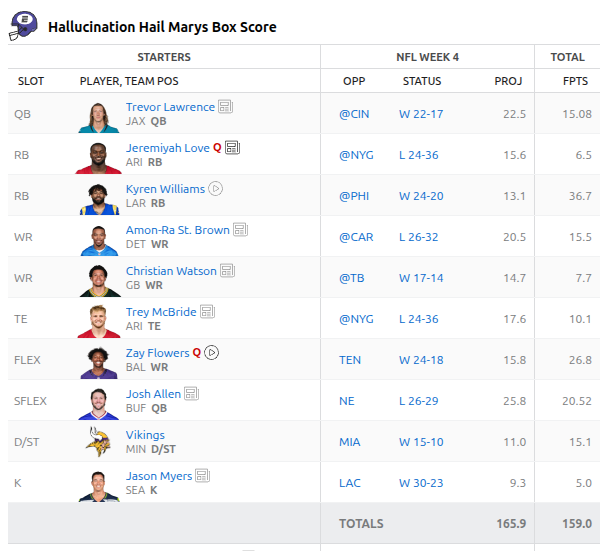
Trevor Lawrence just didn’t even come close to his projections. The Seahawks don’t kick field goals so we just got 5 extra points. Trey McBride was fighting with the referees… Kyren Williams and Zay Flowers though, amazing players. We love them.
Here is the line up for week 5
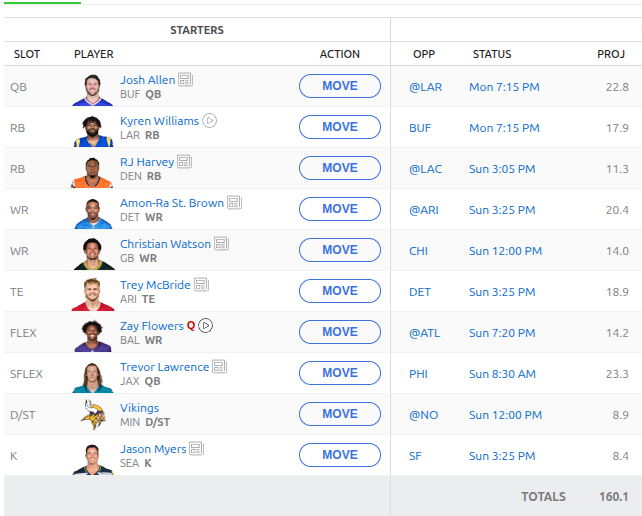
Hopefully we get back on our win streak!
Follow along and never miss an update by subscribing to the mailing list.
Leave a Reply