Category: Claude Code Skills

  • Troubleshooting Jenkins Pipelines with AI

    Do you love or hate Jenkins? I feel like a lot of the DevOps world has issue with it but, this post and system could easily be modified to any CI/CD tool.

    One thing I do not enjoy about Jenkins is reading through its logs and trying to find out why my pipelines have failed. Because of this I decided this is a perfect use case for an AI to come in and find the problem and present possible solutions for me. I schemed up this architecture:

    ┌─────────────────┐     ┌─────────────────┐     ┌─────────────────┐
    │    Jenkins      │     │   API Gateway   │     │   Ingestion     │
    │  (Shared Lib)   │────▶│    /webhook     │────▶│    Lambda       │
    └─────────────────┘     └─────────────────┘     └────────┬────────┘
                                                             │
                                                             ▼
    ┌─────────────────┐     ┌─────────────────┐     ┌─────────────────┐
    │   SQS Queue     │◀────│   Analyzer      │◀────│   SQS Queue     │
    │  (Dispatcher)   │     │    Lambda       │     │   (Analyzer)    │
    │     + DLQ       │     │   (Bedrock)     │     │     + DLQ       │
    └────────┬────────┘     └─────────────────┘     └─────────────────┘
             │
             ▼
    ┌─────────────────┐     ┌─────────────────┐
    │   Dispatcher    │────▶│   SNS Topic     │────▶ Email/Slack/etc. 
    │    Lambda       │     │ (Notifications) │
    └─────────────────┘     └─────────────────┘

    A simple explanation is that when a pipeline fails we are going to send the logs to an AI and it will send us the reasoning as to why the failure occurred as well as possible troubleshooting steps.

    Fine. This isn’t that interesting. It saves time which is awesome. Here is a sample output into my Slack:

    This failure is because I shutdown my Docker Swarm as I migrated to K3s.

    Here is the same alert via email from SNS:

    So why build this? Well, this weekend I worked on adding “memory” to this whole process in preparation of two things:

    1. MCP Server
    2. Troubleshooting Runbook(s)

    Jenkins already has an MCP server that works great in Claude Code. You can use it to query jobs, get logs, have Claude Code troubleshoot, resolve and redeploy.

    Unless you provide Claude Code with ample context about your deployment, its architecture and the application it might not do a great job fixing the problem. Or, it might change some architecture or pattern that is not to your organization or personal standards. This is where my thoughts about adding memory to this process comes in.

    If we add a data store to the overall process and log an incident, give it unique identifiers we can begin to have patterns and ultimately help the LLM make better decisions about solving problems within pipelines.

    Example:

    {
     "PK": "FP#3315b888564167f2f72185c51b3c433b6bfa79e7b0e4f734e9fe46fe0df2d8c6",
     "SK": "INC#66a6660f-6745-468f-b516-41c51b8d0ecf",
     "build_number": 69,
     "category": "environment",
     "confidence_score": 0.65,
     "created_at": "2026-02-09T14:50:26.322599+00:00",
     "fingerprint": "3315b888564167f2f72185c51b3c433b6bfa79e7b0e4f734e9fe46fe0df2d8c6",
     "incident_id": "66a6660f-6745-468f-b516-41c51b8d0ecf",
     "job_name": "java-test-project",
     "relevant_log_lines": [
      "✗ Deployment to Docker Swarm failed",
      "ERROR: script returned exit code 255",
      "Stage \"Verify Deployment\" skipped due to earlier failure(s)",
      "unset SSH_AGENT_PID; echo Agent pid 2897883 killed; [ssh-agent] Stopped."
     ],
     "requires_human_review": true,
     "reviewed_by": null,
     "root_cause": "Docker service deployment to Swarm failed with exit code 255 during SSH command execution",
     "status": "suspected",
     "suggested_fixes": [
      "SSH into the Docker Swarm manager node manually and run: `docker service ls` and `docker node ls` to verify Swarm is operational and the manager node is reachable",
      "Check SSH connectivity and credentials by running: `ssh -i <ssh-key> <swarm-manager-host> 'docker info'` to ensure the Jenkins agent can authenticate and execute Docker commands",
      "Review the SSH agent logs immediately before the failure (lines truncated in output) - the actual error message from the `docker service create` or `docker service update` command is not visible in the provided logs",
      "Verify the Docker image `192.168.1.23:5000/test-java-app:69` is accessible from the Swarm manager node by running: `docker pull 192.168.1.23:5000/test-java-app:69` on the target host",
      "Check Docker Swarm manager node resources (disk space, memory) with: `df -h` and `free -m` as resource exhaustion can cause service creation failures with exit code 255"
     ],
     "updated_at": "2026-02-09T14:50:26.322599+00:00"
    }

    This is the log from the same incident I showed before. The same information now stored. So, now, if we hook up an MCP to our AI and ask it to find patterns we get something like this:

    Here's the summary of your 18 incidents across 7 jobs, all from today and yesterday:
    
      ---
      Category Breakdown
      ┌───────────────┬───────┬─────┐
      │   Category    │ Count │  %  │
      ├───────────────┼───────┼─────┤
      │ environment   │ 11    │ 61% │
      ├───────────────┼───────┼─────┤
      │ configuration │ 6     │ 33% │
      ├───────────────┼───────┼─────┤
      │ code          │ 1     │ 6%  │
      └───────────────┴───────┴─────┘
      Most Common: environment (11 incidents)
    
      The dominant failure pattern is Kubernetes deployment rollout timeouts — pods failing to become ready after kubectl apply or
      kubectl rollout status. This hits nearly every job:
    
      - accounting-cloud (4 incidents) — rollout timeout + health check timeout
      - oovoo-javer-bot (1) — rollout timeout, also noted k3ks-3 node is NotReady
      - dividend-tracker (3) — rollout timeout + health check wait timeout
      - aws-cost-optimizer (1) — rollout timeout
      - Password Generator (1) — rollout timeout
      - homelab-proxy (1) — deployment timeout
    
      The root cause is consistently the same: pods don't start in time. The AI analysis flags likely causes as ImagePullBackOff,
      CrashLoopBackOff, resource constraints, and the NotReady node (k3ks-3).
    
      Second Most Common: configuration (6 incidents)
    
      These are more varied:
    
      - oovoo-javer-bot (3) — missing Jenkins credential oovoo-javer-bot-env, missing K8s secret oovoo-javer-bot-secrets, empty
      withCredentials block
      - homelab-proxy (2) — Traefik CRD API version mismatch (traefik.containo.us/v1alpha1 vs traefik.io/v1alpha1)
      - dividend-tracker (1) — PVC resize forbidden (can't shrink PVC below current capacity)
      - food-cost-app-pipeline (1) — Terraform state lock held by another process
    
      Key Takeaway
    
      Your k3s cluster is the bottleneck. 11 of 18 failures are pods not starting in time. The k3ks-3 NotReady node suggests a
      cluster health issue that's likely causing scheduling failures or resource pressure across all your deployments. Fixing that
      node (or removing it from the cluster) would likely resolve the majority of these incidents.
    

    Ignore the fact that many of these are the same error. I did a lot of this on purpose.

    What you SHOULD imagine is how does this run inside your environment(s) and what data would you collect. If you think about it, you should realize you would find the bottlenecks of your own deployments. You would find the spots where your developers are getting stuck. You can then create solutions to those issues and hopefully reduce that trend line.

    Next steps.

    We need a human in the loop element. I’m going to start crafting a web interface where these issues are presented to a human engineer. That engineer could add notes or better steps for resolution. With that data added into the memory the troubleshooting agent can follow best practices of your organization or home lab.

    So, stay tuned for the web interface. If you’re interested in setting this up for yourself shoot me a message and I’ll give you access to the repository.

  • How I utilize Claude Code and AI to build complex applications

    “A Fever You Can’t Sweat Out – 20th Anniversary Deluxe” is an album that came out? Wow. I remember seeing Panic! as a teenager…

    I stayed away from AI for a long time. I think a lot of people in my field were nervous about security, bad code, incorrect information and much more. In the early days of ChatGPT it was easy to have the AI hallucinate and come up with some nonsense. While its still possible for this to happen I found a workflow that has helped me build applications and proof of concept work very quickly.

    First – I have always given AI tasks that I can do myself.
    Second – If I can’t do a task, I need to learn about it first.

    These aren’t really rules, but, things I think about when I’m building out projects. I won’t fall victim to the robot uprising!

    Let’s talk about my workflows.

    Tools:
    – Claude (Web)
    – Claude Code
    – Gemini
    – Gemini CLI
    – ChatGPT
    – Todoist

    I pay for Claude and I have subscriptions to Gemini Pro through my various GSuite Subscriptions. ChatGPT I use for free. ToDoist is my to do app of choice. I’ve had the subscription since back in my Genius Phone Repair days to manage all of the stores and their various tasks.

    The Flow

    As with most of you, I’m sure you get ideas or fragments of ideas at random times. I put these into ToDoist where I have a project called “Idea Board” its basically a simplified Kanban board with three columns:

    Idea | In progress | Finished

    The point of this is to track things and get them out of my brain to free up space in there everything else that happens in my life. I utilize the “In Progress” column for when I’m researching or actually sitting down to process the idea with more detail. Finally, the “Finished” column is utilize for either ideas that I’m not going to work on or ideas that have turned into full projects. This is not the part of the project where I actually detail out the project. It’s just a landing place for ideas.

    The next part of the flow is where I actually detail out what I want to do. If you have been utilizing Claude Code or Gemini CLI or Codex you know that input is everything and it always has been since AI became consumer ready. I generally make a folder on my computer and start drafting my ideas with more detail into markdown files. If we look at CrumbCounts.com as an example, I started with simply documenting out the problem I was trying to solve:

    Calculate the cost for this recipe.

    In order to do that we then need to put a bunch of pieces together. Because I am an AWS Fanboy most of my designs and architectures revolve around AWS but some day I might actually learn another cloud and then utilize that instead. Fit for purpose.

    Anyway, the markdown file will continually grow as I start to build the idea into a mostly detailed out document that lays out the architecture, design principals, technologies to utilize, user flow and much more. The more detail the better!

    When I am satisfied with the initial idea markdown file I will provide it to Gemini. Its not my favorite AI model out there but it possess the ability to take in and track a large amount of context which is useful when presenting big ideas.

    I assign Gemini the role of “Senior Technology Architect”. I assume the role of “stakeholder”. Gemini’s task is to review the idea that I have and either validate or, create the architecture for the idea. I prompt it to return back a markdown file that contains the technical architecture and technical details for the idea. At this point we reach our first “Human in the loop” point.

    Because I don’t trust our AI overlords this is the first point at which I will fully review the document output by Gemini. I need to make sure that what the AI is putting out is valid, will work, and is using tools and technology that I am familiar with. If the output is proposing something that i’m unsure of I need to research or ask the AI to utilizing something else.

    After I am satisfied with the architecture document I place that into the project directory. This is where we change AI Models. You see Gemini is good at big picture stuff but not so good at specifics (in my opinion). I take the architecture document and provide it to Claude (Opus, web browser or app) and give it the role of Senior Technology Engineer. Its job is to review the architecture diagram, find any weak points or things that are missing or, sometimes, things that just won’t work. Then build a report and an engineering plan. This plan details out SPECIFIC technologies, patterns and resources to use.

    I usually repeat this process a few times and review each LLM’s output looking for things that might have been missed by either myself or the AI. Once I have them both in a place that I feel confident this is when I actually start building.

    Because I lack trust in AI, I make my own repository in GitHub and setup the repository on my local machine. I do allow the AI the ability to commit and push code to the repository. Once the repository has been created I have Gemini CLI build out the application file structure. This could include:

    • Creating folders
    • Creating empty files
    • Creating base logic
    • Creating Terraform module structures

    But NOTHING specific. Gemini, once again, is not good at detailed work. Maybe i’m using it wrong. Either way, I now have all of the basic structure. Think of Gemini as a Junior Engineer. It knows enough to be dangerous so it has many guardrails.

    # SAMPLE PROMPT FOR GEMINI
    You are a junior engineer working on your first project. Your current story is to review the architecture.md and the enginnering.md. Then, create a plan.md file that details out how you would go about creating the structure of this application. You should detail out every file that you think needs to be created as well as the folder structure. 

    Inside of the architecture and engineering markdown files there is detail about how the application should be designed, coded, and architected. Essentially a pure runbook for our junior engineer.

    Once Gemini has created its plan and I have reviewed it, I allow it write files into our project directory. These are mostly placeholder files. I will allow it to write some basic functions for coding and layout some Terraform files that are simple.

    Once our junior engineer, Gemini, has completed I usually go through and review all of the files against the plan that it created. If anything is missing I will direct it to review the plan again and make any corrections. Once the code is at a place where I am happy with it, I create my first commit and push this baseline into the repository.

    At this point its time for the heavy lifting. Time to put my expensive Anthropic subscription to use. Our “Senior Developer” Claude (Opus model) is let loose on the code base to build out all the logic. 9 times out of 10 I will allow it to make all the edits it wants and just let it go while I work on something else (watching YouTube).

    # SAMPLE CLAUDE PROMPT
    You are a senior developer. You are experienced in many application development patterns, AWS, Python and Terraform. You love programming and its all you ever want to do. Your story in this sprint is to first review the engineering.md, architecture.md and plan.md file. Then review the Junior Engineer's files in this project directory. Once you have a good grasp on the project write your own plan as developer-plan.md. Stop there and I, your manager, will review.

    After I review the plan I simply tell it to execute on the plan. Then I cringe as my usage starts to skyrocket.

    Claude will inevitably have an issue so I take a look at it every now and then, respond to questions if it has any or allow it to continue. Once it reaches a logical end I start reviewing its work. At this point it should have built me some form of the application that I can run locally. I’ll get this fired up and start poking around to make sure the application does what I want it to do.

    At this point we can take a step back from utilizing AI and start documenting bugs. If I think this is going to be a long project this is where I will build out a new project in Todoist so that I can have a persistent place to take notes and track progress. This is essentially a rudimentary Jira instance where each “task” is a story. I separate them into Bugs, Features, In Progress, Testing.

    My Claude Code utilizes the Todoist MCP so it can view/edit/complete tasks as needed. After I have documented as much as I can find I let Claude loose on fixing the bugs.

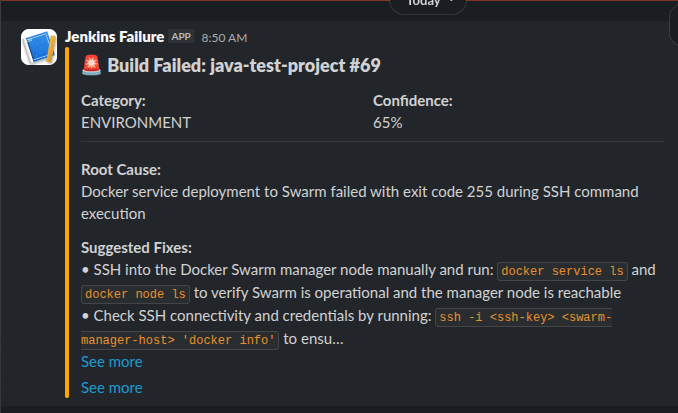
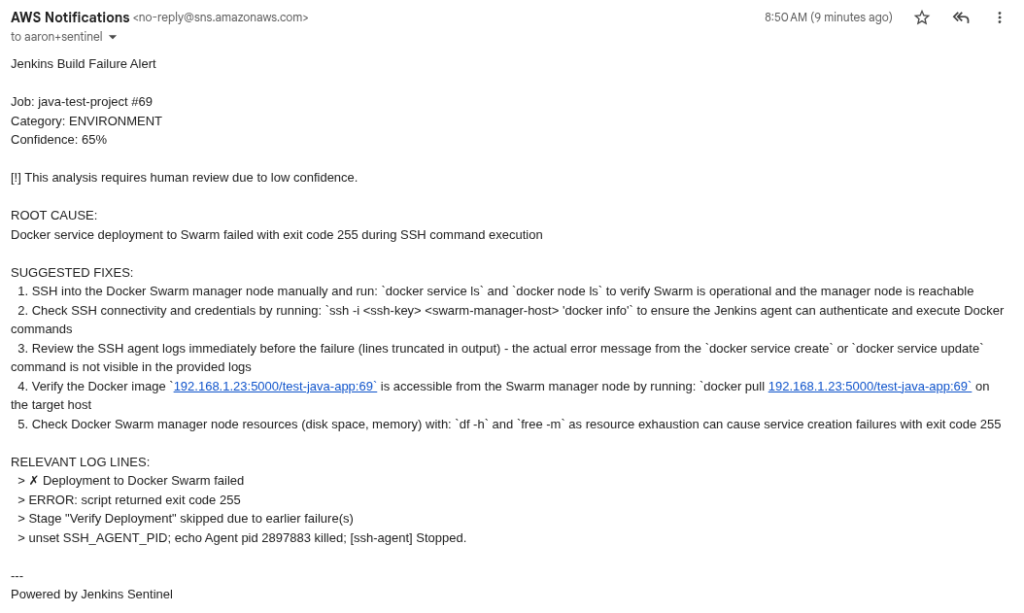
    I think the real magic also comes with automation. Depending on the project I will allow Claude Code access to my Jenkins server via MCP. This allows Claude code to monitor and troubleshooting builds. This allows Claude to operate independently. What happens is that it will create new branches and push them into a development environment triggering an automated deployment. The development environment is simply my home lab. I don’t care if anything breaks there and it doesn’t really cost any money. If the build fails, Claude can review the logs and process a fix and start the CI/CD all over again.

    Ultimately, I repeat the bug fix process until I get to my minimal viable product state and then deploy the application or project into whatever is deemed the production environment.

    So, its 2026, we’re using AI to build stuff. What is your workflow? Still copying and pasting? Not using AI at all? AI is just a bubble? Feel free to comment below!

  • Jenkins Skill for Claude Code

    I’ve been doing a lot more with Claude Code and before you shame me for “vibe coding” hear me out.

    First – AI might be a bubble. But, I’ve always been a slow adopter. Anything that I have AI do, I can do myself. I just find it pointless to spend hours writing Terraform modules when Claude, or another model, can do it in a few seconds. I’ll post more on my workflow in a later blog.

    One of the things that I find tedious is monitoring builds inside of Jenkins. Especially when it comes to troubleshooting. If AI writes the code, it should fix it too right?

    I built a new skill for my Claude Code so that it can view and monitor my locally hosted Jenkins instance and automatically handle any issues. The purpose of this is straight forward. Once I approve a commit to the code base my builds are going to automatically trigger. Claude Code needs to make sure that what it wrote is actually deployed.

    Inside of the markdown file you’ll find examples of how the skill can be used including:

    • List
    • View
    • Start/Stop

    These are all imperative features so that the AI can handle the pipelines accordingly. This has resulted in a significant increase in the time it takes me code and deliver a project immensely. I also don’t have to copy and paste logs back to the AI for it to troubleshoot.

    For you doomers out there – This hasn’t removed me from my job. I still act as the infrastructure architect, the software architect, the primary human tester, the code reviewer and MUCH more.

    Anyway, I’ll be publishing more skills so be sure to star the repository and follow along by subscribing to the newsletter!

    GITHUB

    Don’t miss an update