I recently had a request to monitor disk space. Being that I don’t use a traditional monitoring platform but rather send all of my alerting to Slack I wondered how this would work.
There is not a direct metric in CloudWatch so we will utilize the scripts available in this guide.
You can follow along on the Amazon guide or follow some simple steps here geared towards Ubuntu based Linux distributions.
First, let’s install some dependancies:
sudo apt-get install unzip
sudo apt-get install libwww-perl libdatetime-perl
Next, we will download the scripts from Amazon:
curl https://aws-cloudwatch.s3.amazonaws.com/downloads/CloudWatchMonitoringScripts-1.2.2.zip -O
Once downloaded you can unpack the ZIP file:
unzip CloudWatchMonitoringScripts-1.2.2.zip && \ rm CloudWatchMonitoringScripts-1.2.2.zip && \ cd aws-scripts-mon
This will put the scripts into a directory called aws-scripts-mon inside of whatever directory you are currently in. I recommend doing this inside of /home/your-user.
There are a few ways to allow your scripts to have permissions to CloudWatch. I preferred to create the awscreds.conf method but you can also give your instance an IAM role or specify the credentials inline. If you are unsure of how to create IAM policies or roles feel free to message me and we can chat more about that.
Inside the directory there is a template file that you can utilize to generate your awscreds.conf file.
cp awscreds.template awscreds.conf && vi awscreds.conf
Modify the file as needed and save and close it.
Now let’s test the scripts to ensure functionality:
./mon-put-instance-data.pl --disk-space-util --disk-path=/ --verify --verbose
You should see a “Completed Successfully” message. If not, troubleshoot as needed.
The scripts have a lot of functionality but we are specifically looking at disk usage. I added the following line as a Cron Job:
0 * * * * /home/ubuntu/aws-scripts-mon/mon-put-instance-data.pl --disk-space-util --disk-path=/
This runs the script every hour on the hour and reports the data to CloudWatch.
Now that our data is being put into CloudWatch we need to alert on any issues. For the purpose of testing I created an alarm that was below my threshold so I could verify the alerting worked. You can adjust as you need to.

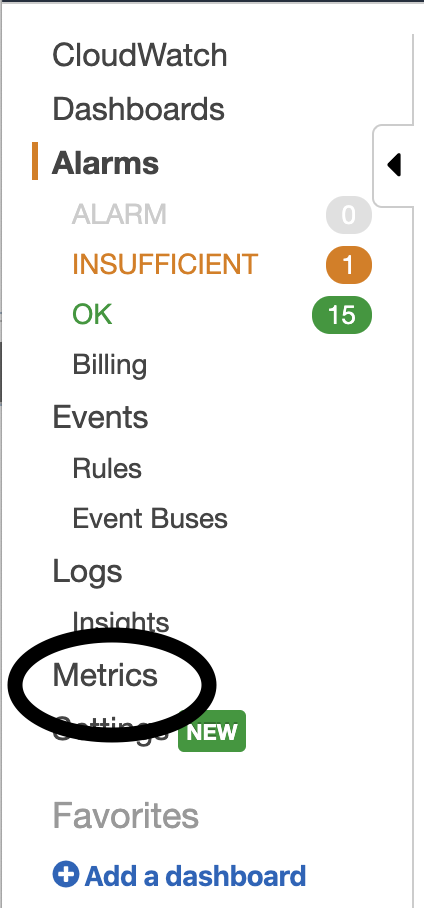
Login to your AWS Management Console and navigate to the CloudWatch Console. Your data will be placed into the “Metrics” tab. Once the Metrics tab is open you will see a section called “Linux Systems”. Navigate to this and you should metrics called “Filesystem, InstanceId, Mountpath”. This is where your metrics live. You can navigate around here and view your metrics in the graphing utility. Once you have verified that the data is accurate you can create an alarm based on this metric.
Navigate to the Alarms section of CloudWatch. Click “Create alarm” in the top right corner. Follow the steps to create your Alarm. For Metric navigate to the metric we found in the previous step. For Conditions, I chose the following:
Threshold Type: Static
Whenever DiskSpaceUtilization is…: Greater than the threshold
Than…: 45% (Note this value will change based on your actually usage. For testing I recommend setting this to a value lower than your actual usage percentage so that your alarm will fire.)
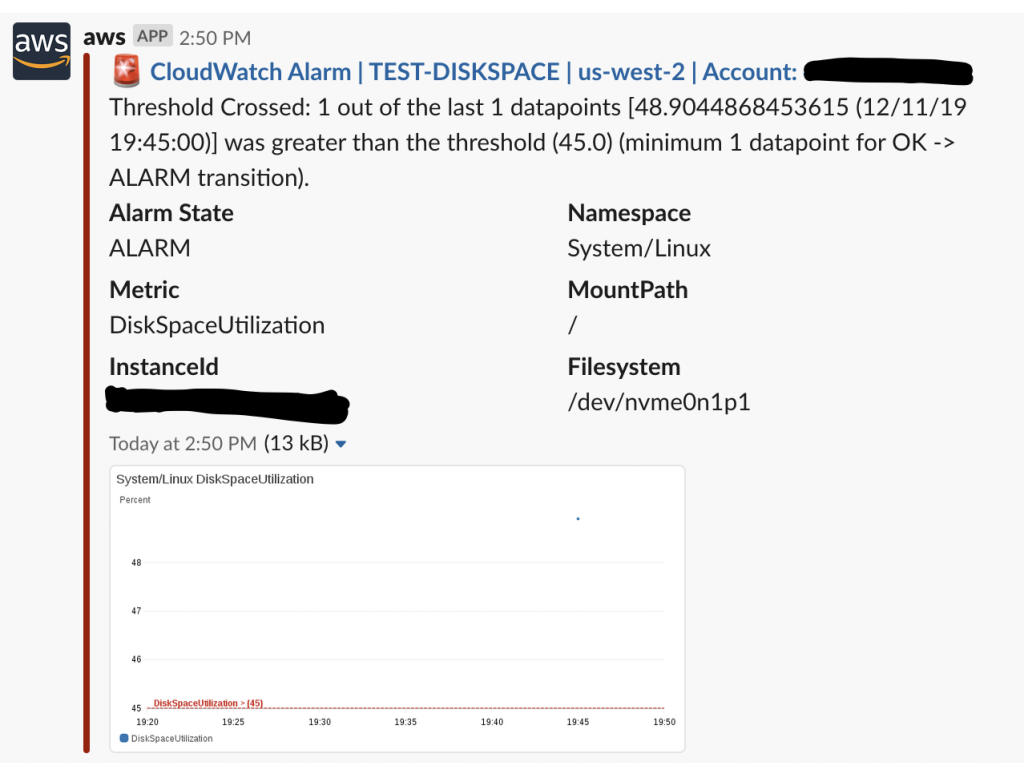
Click Next to continue. On the following page you can setup your notifications. I covered creating an AWS Chatbot here I have all of my CloudWatch Alarms sent to an SNS topic called aws-alerts. You can create something similar and have your AWS Chatbot monitor that topic as well. Once the alarm fires you should be getting an alert in your specified Slack Channel that looks something like this:

Once your alarm is firing you can fine tune your thresholds to notify you as you need!
Leave a Reply